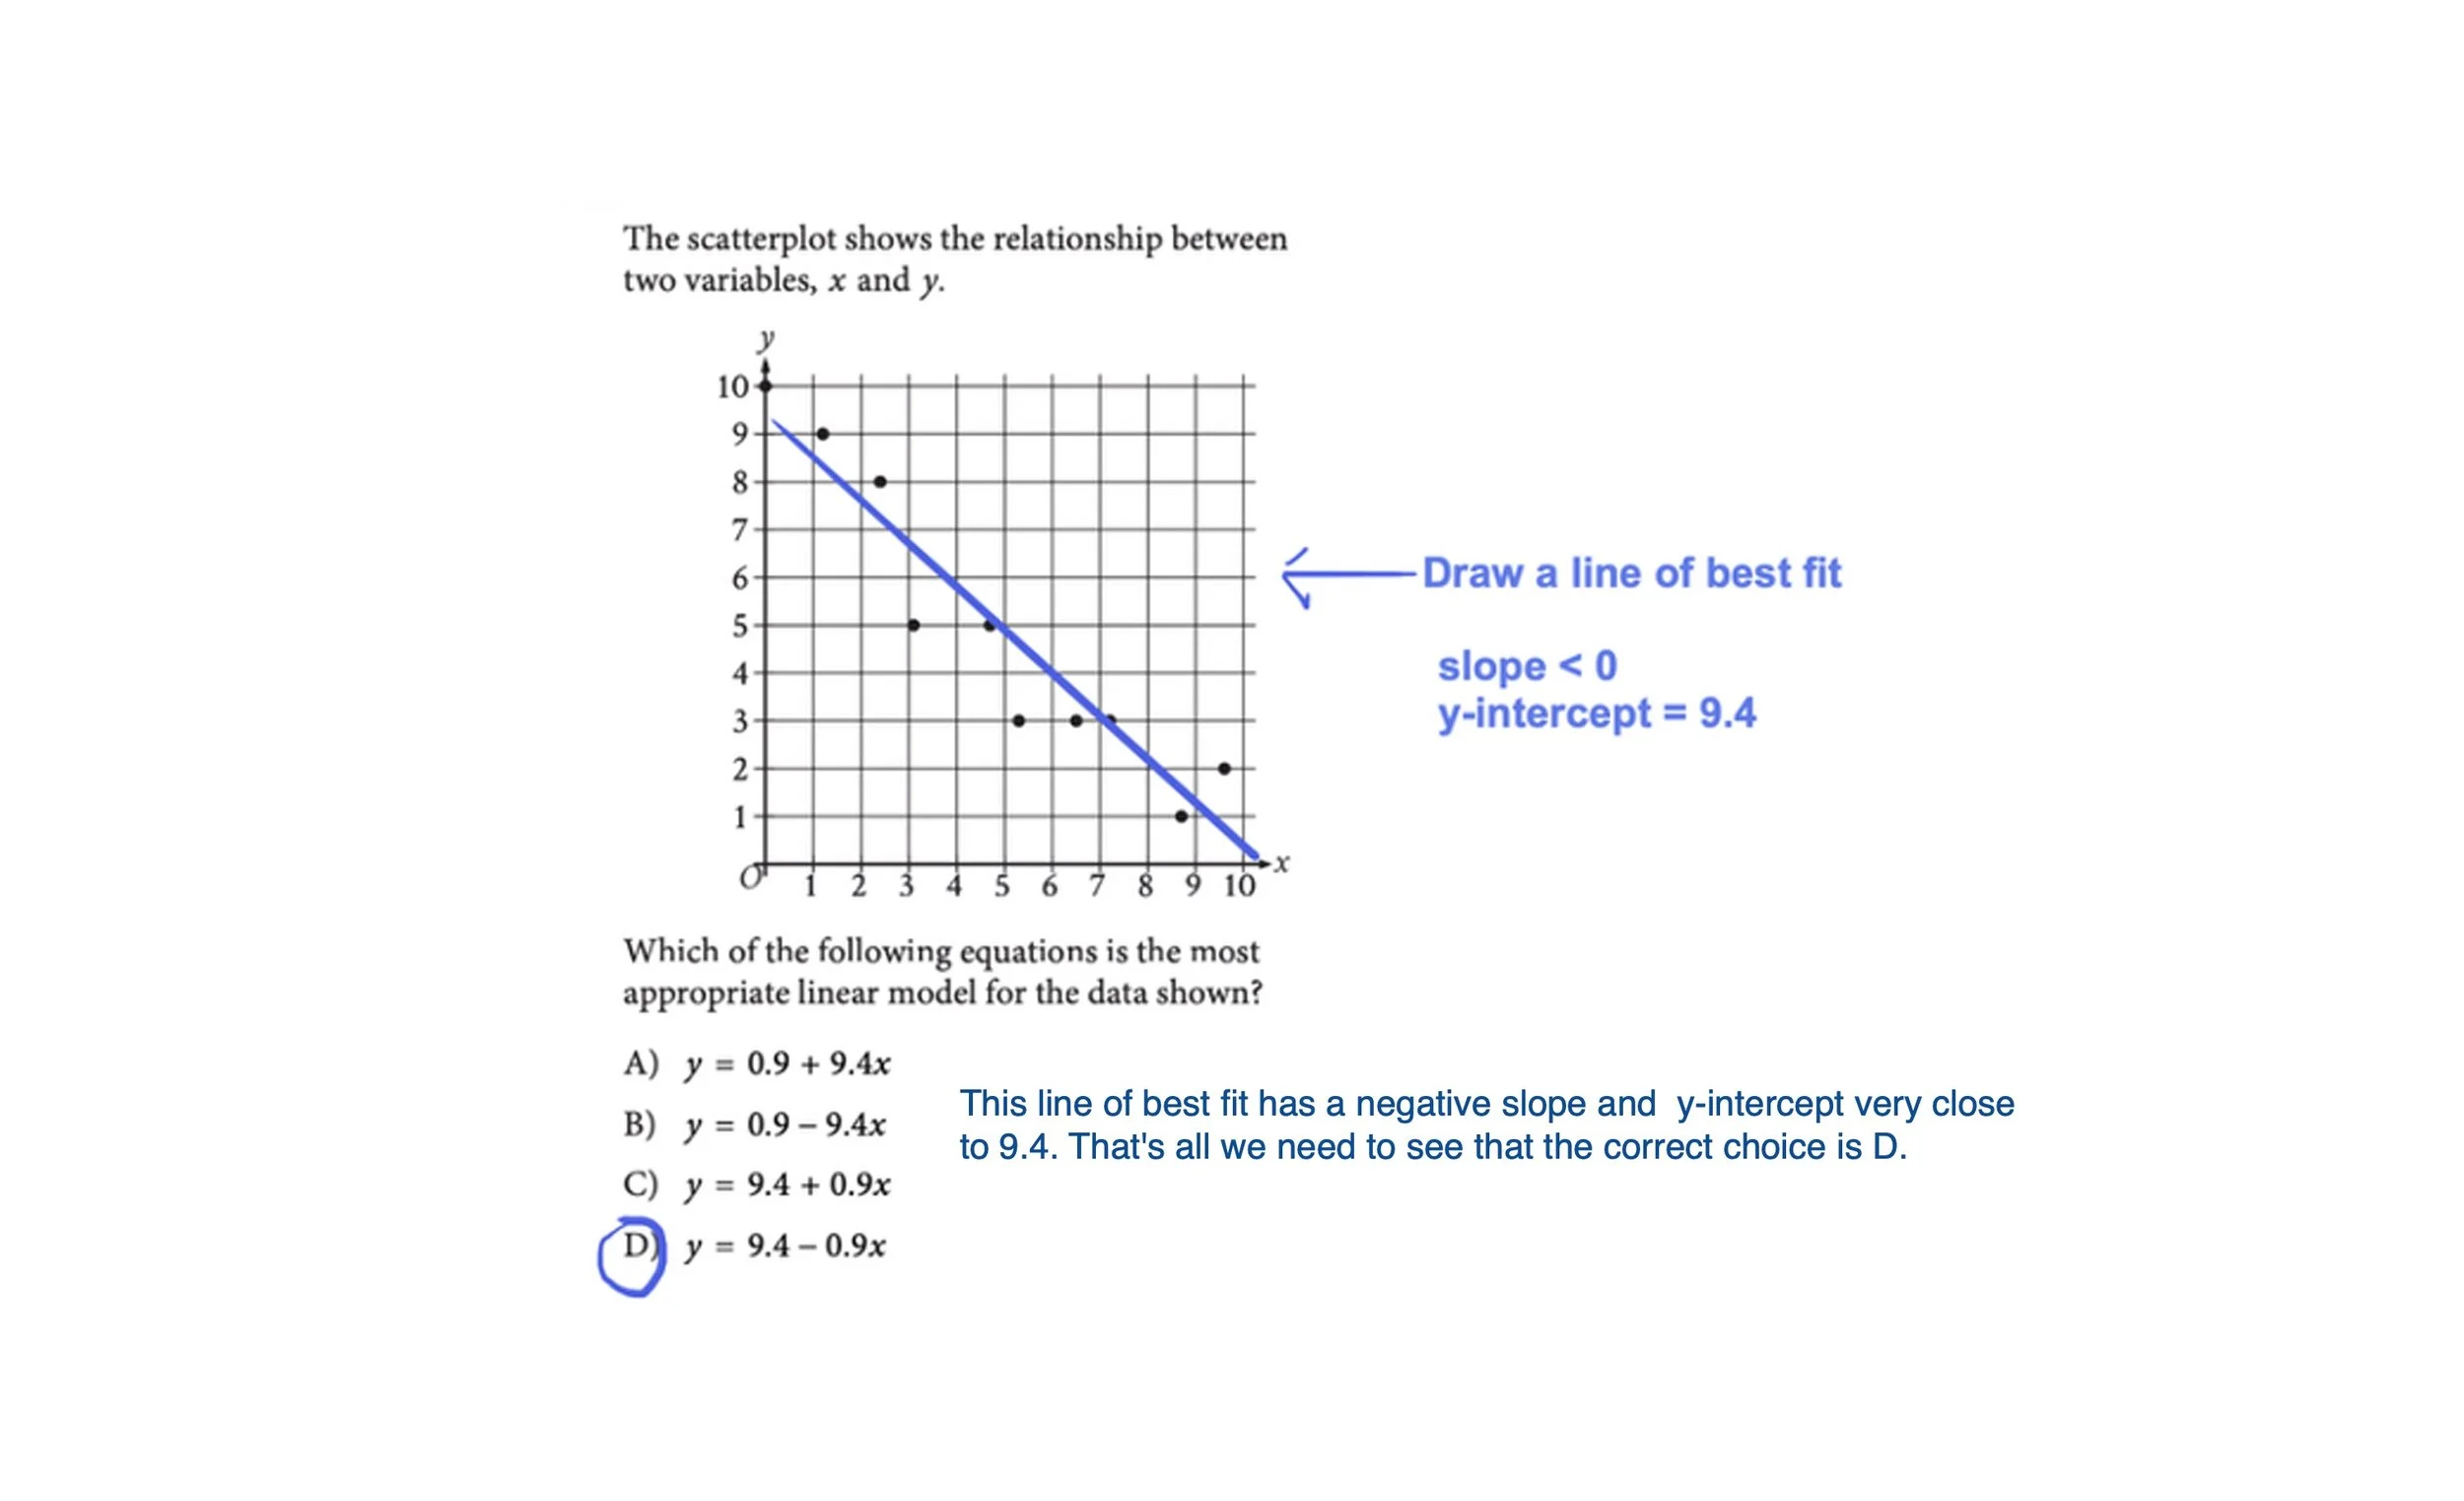
Category: Data & Statistics
The line of best fit minimizes the overall distance from the data points to the line. Use it to make predictions.
Key vocabulary:
• Positive association: as x increases, y increases
• Negative association: as x increases, y decreases
• Linear vs. nonlinear: does the trend follow a straight line or a curve?
What the SAT asks: Given a scatterplot with a line of best fit, find the predicted y-value for a given x (substitute into the equation), or describe the association.
Practice tip: Read the axes carefully — especially units. A common trap is ignoring that the y-axis starts at a value other than zero, which distorts the visual impression of the slope.
Let’s try a simple example: